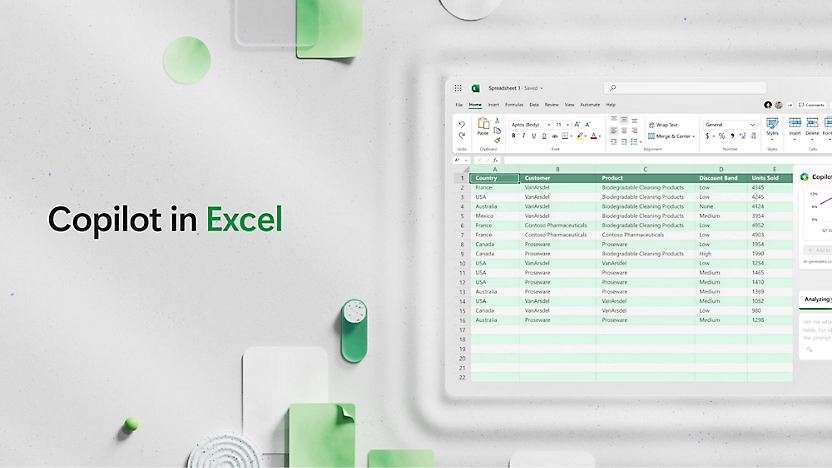
Microsoft Excel
Data Management and Analysis
Microsoft Excel provides powerful tools for data management and analysis. Organize, analyze, and visualize information with ease.
Improve your decision-making process based on accurate and well-organized data.
Learn More
Analysis of Complex Data
Use PivotTables, charts, and formulas for in-depth data analysis. Excel helps you identify trends and make informed business decisions.

Integration and Collaboration
Work together online seamlessly. Excel integrates with Teams and SharePoint, allowing you to share files and collaborate with colleagues without interruptions.

Access from All Platforms
Open and edit spreadsheets from your computer, tablet, or smartphone. Excel’s web and mobile versions ensure you stay connected to your data at all times.
Advanced Data Visualization
Transform dry numbers into impressive visuals. Use modern charts and graphs to better perceive information and present it effectively.
Powerful Formulas
Perform complex calculations easily using Excel’s comprehensive range of functions and formulas.
Visual Analysis
Create dynamic charts and graphs to reveal insights and trends hidden in your data.
Power BI Integration
Connect Excel with Power BI to create interactive, enterprise-level reports and dashboards.
